The Bureau of Labor Statistics (BLS) released its monthly Current Employment Statistics (CES) report and Current Population Survey (CPS) for April 2023 on Friday, May 5th. The monthly change in employment given by the CES and the unemployment rate from the CPS are seen as the standard gauges for assessing the health of the U.S. labor market.
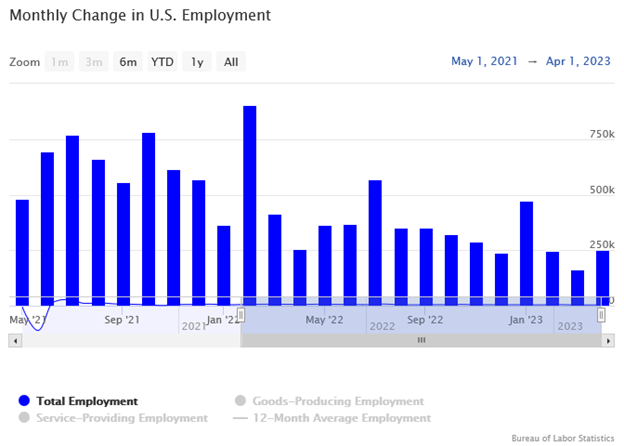
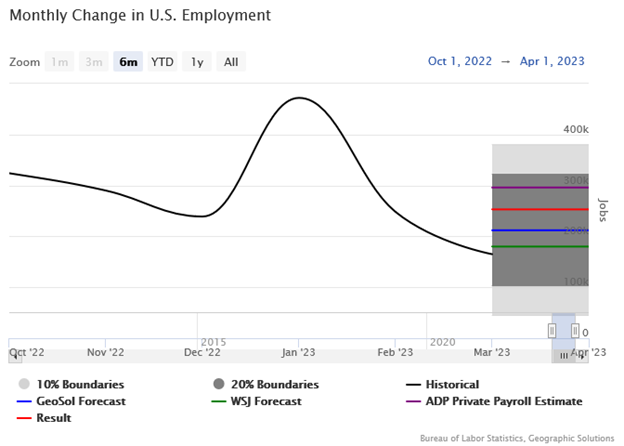
Employment in the U.S. rose by 253,000 jobs. The job results were above the Geographic Solutions, Inc. forecast of 212,000. The forecast outperformed the WSJ estimate of 180,000. April’s unexpectedly strong results are the second disruption to the slowing trend we have seen in hiring, since July 2022. Geographic Solutions, Inc. derives its employment forecast from internal data on the number of job counts and gross posts filed on Geographic Solutions state client sites. The forecast uses unemployment claims data from the U.S. Department of Labor (USDOL).
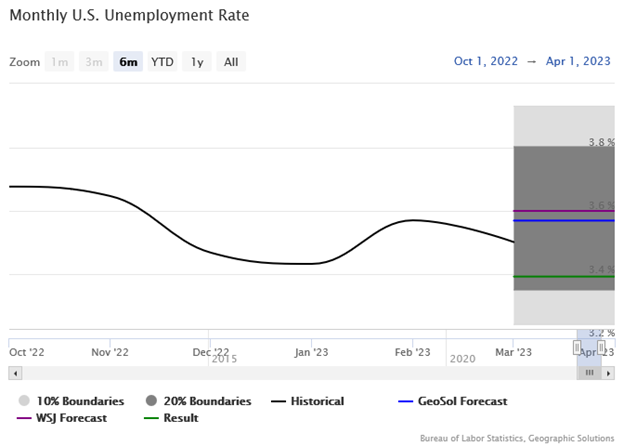
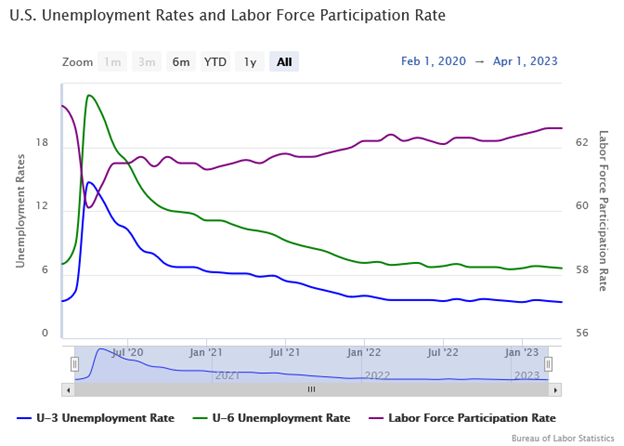
The unemployment rate declined to 3.4%, tying a 50-year low. The Geographic Solutions forecast had anticipated an uptick to 3.6%. The unemployment rate forecast uses internal data on the number of job openings, unemployment applications, and job severances on Geographic Solutions state client sites. The forecast uses unemployment claims data from the USDOL.
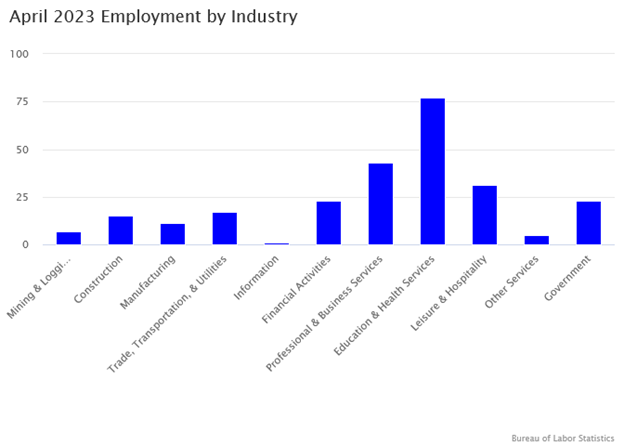
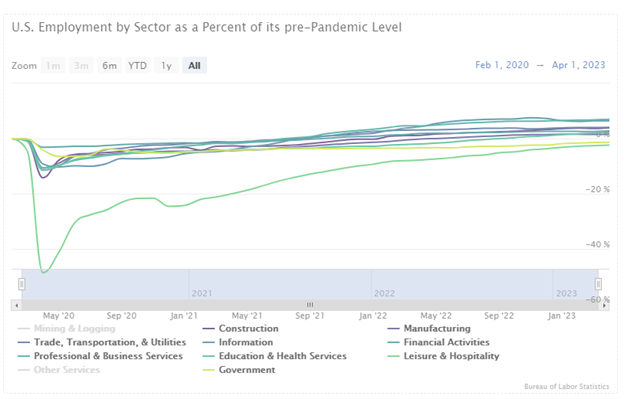
Job creation was strongest in Education & Health Services (77,000). Leisure & Hospitality, Professional & Business Services, and the Government sectors were the other major contributors to employment. All industries saw at least some positive job growth.
Leisure & Hospitality and Government are the only major sectors to remain below their pre-pandemic employment levels.
Labor force participation maintained its 62.6% rate from the previous month. The more expansive U-6 unemployment rate counts discouraged workers who are no longer actively seeking work (and therefore no longer in the labor force) and those that have settled for part-time employment but desire a full-time job. This measure of unemployment declined to 6.6%.
The April employment report is a great sign that the labor market is steadily adding jobs in the face of interest rate increases by the Federal Reserve, even though revisions decreased new job creation by a combined 149,000 in February and March. Additionally, April shows the fallout of the regional bank failures in March which do not seem to have had a dramatic impact. The possibility of avoiding a sustained period of job loss is still a challenge but appears somewhat more feasible after April’s performance.